WADER
WADER is a comprehensive sonar range prediction and Global Ocean Information System which combines environmental data together with user-supplied parameters to generate propagation loss data (PL) and calculate sonar probability of detection.
Designed for users of all abilities, data is generated in real time. Analysis of the data can provide information such as best evasion depth, likely target depths and optimum sonar position.
WADER is supplied with Sonar Parameters for Unclassified Training Systems (SPUTS), global bathymetry, environmental and sediment databases together with a wide variety of oceanographic reference chart types so that WADER has everything it required to perform sonar range predictions out of the box. Users are able to upload their own sensor parameters, high-resolution bathymetry data and customisable chart overlays.

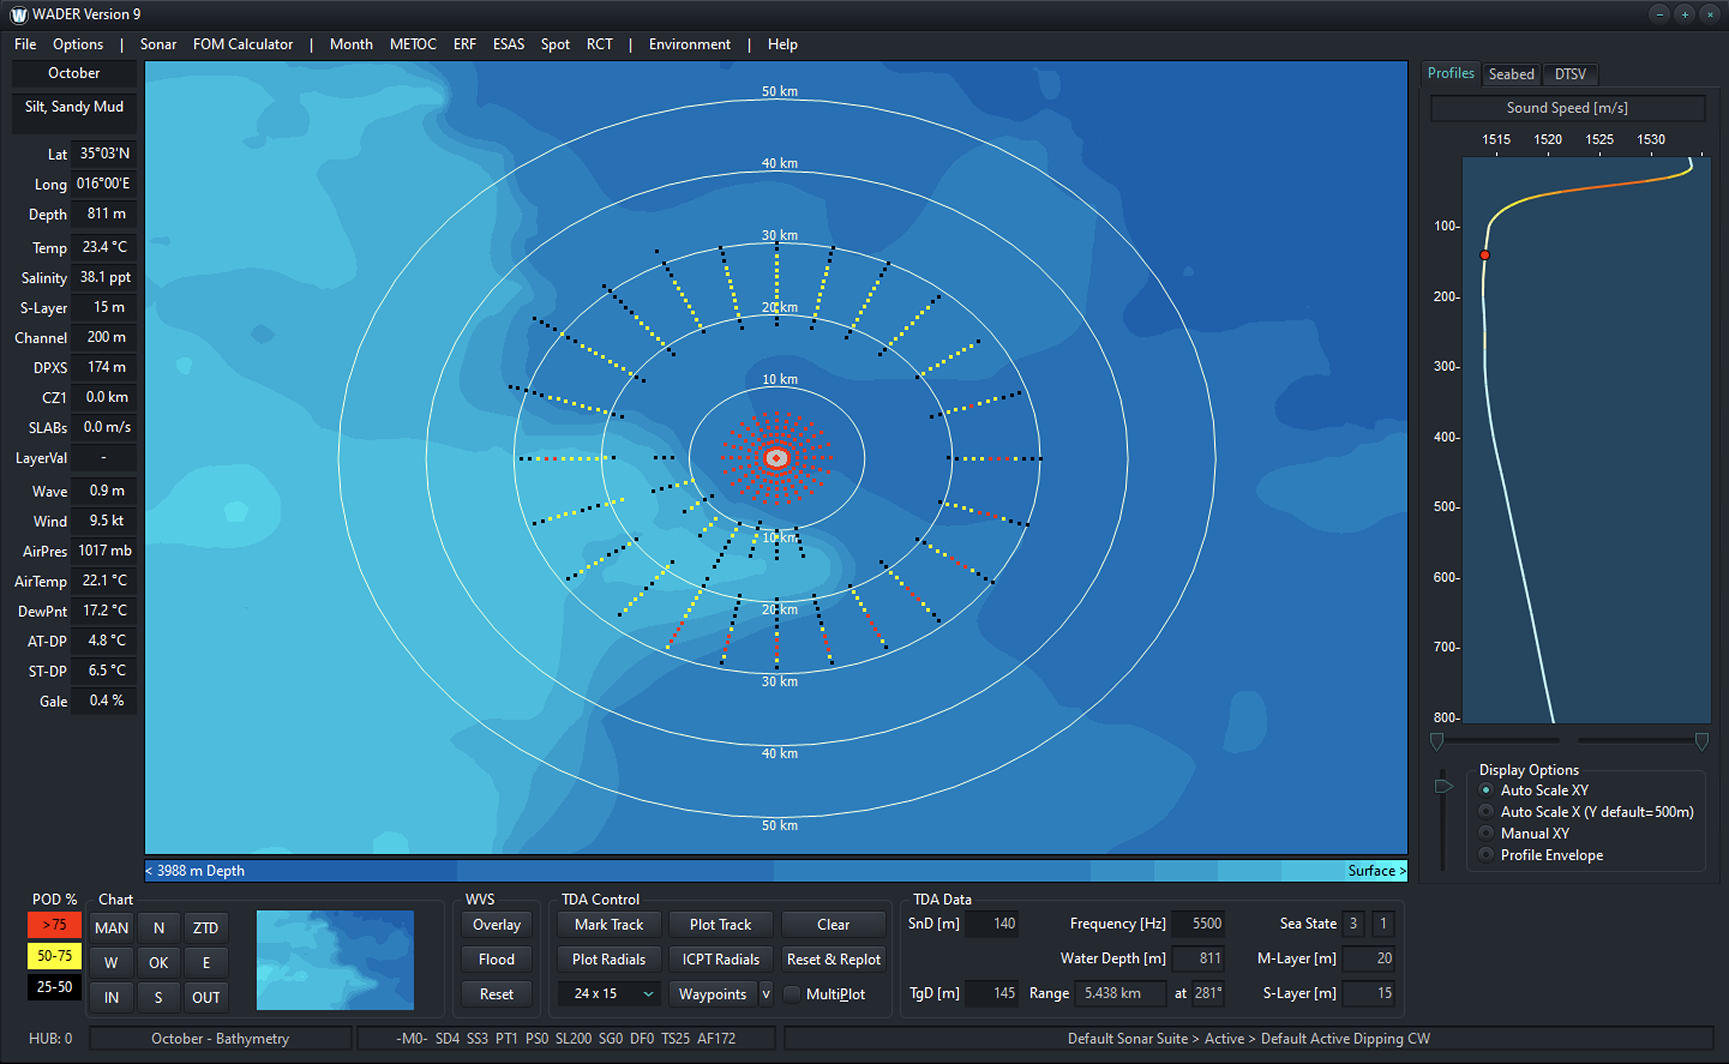
MAIN SCREEN
The Main Screen is the starting point for calculations where users define their area of interest and add detail to the map display. The Main Screen renders 2D sonar performance radial displays and provides access to the 3D Dynamic Area Display (3D DAD). In addition to the on-screen climatology data readouts, optional overlays include:

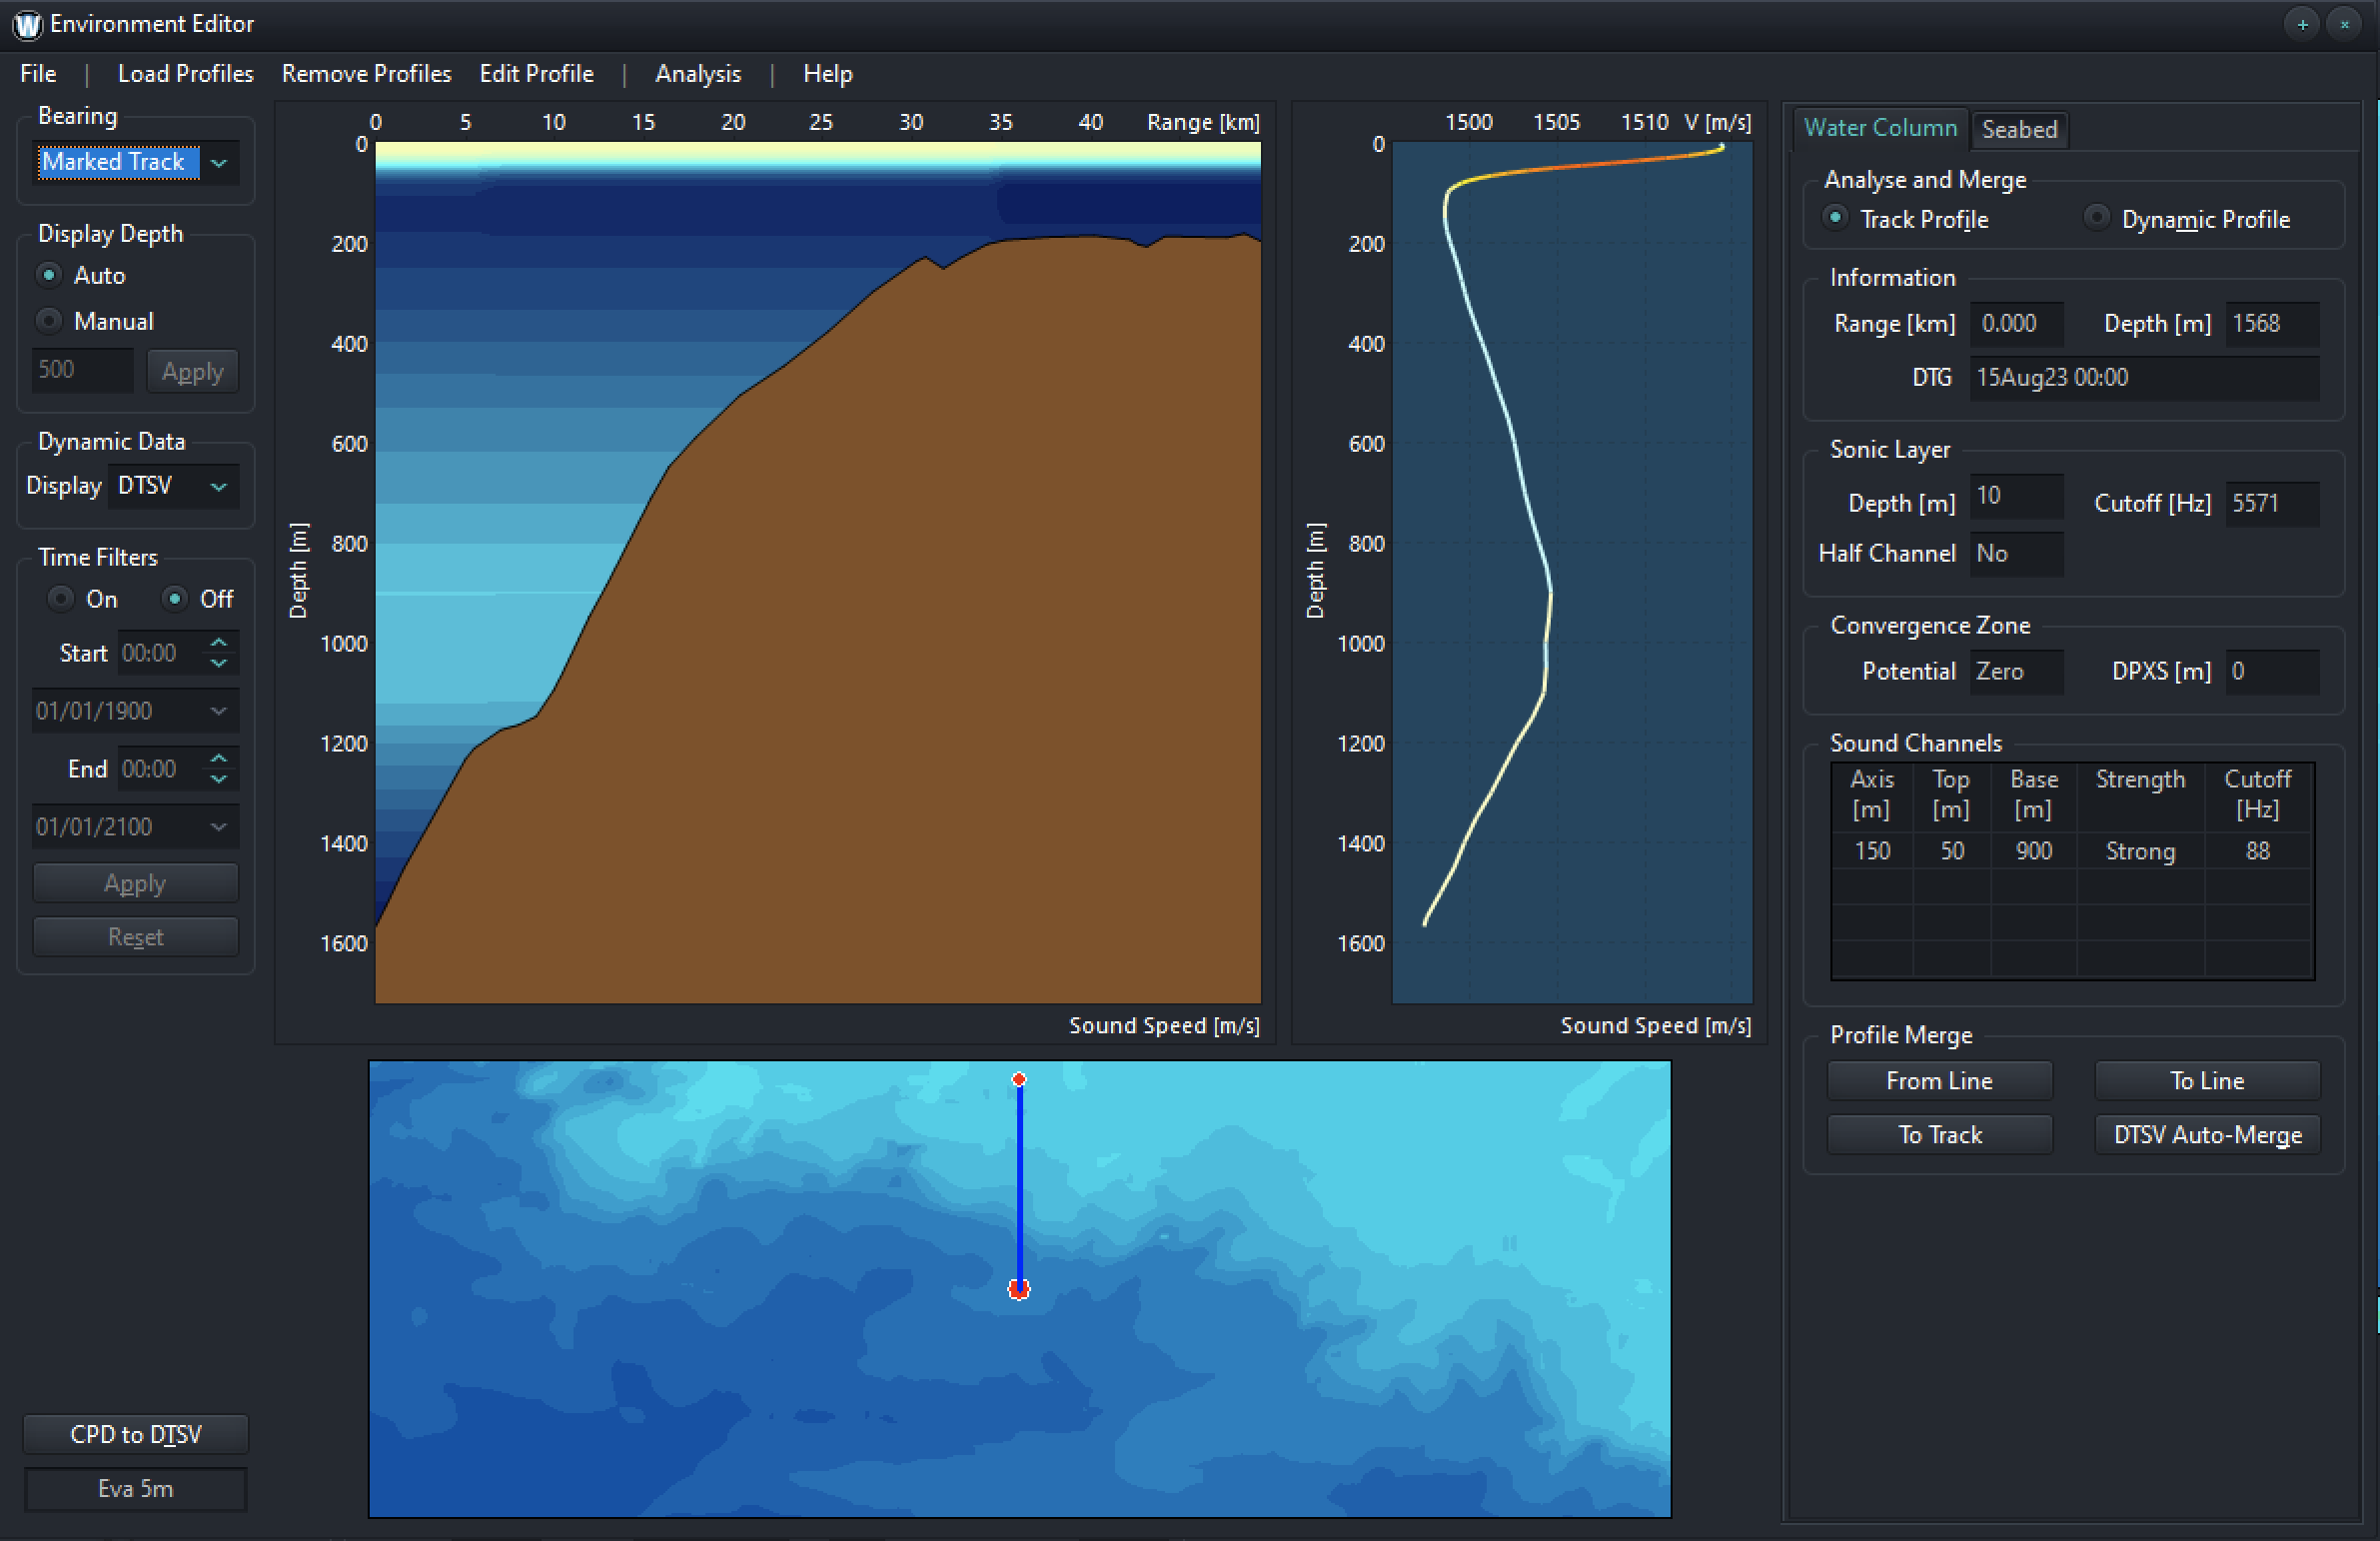
ENVIRONMENT SCREEN
The Environment Editor allows users to edit both the track and operational environment. Users can upload and manage their own (measured) environmental profiles (salinity & SSP) from XBTs using time filters, edit the seabed properties and analyse the sound channel. The data is visualised using the seabed cross section and profile viewers. High resolution water column profiles can be merged both manually or automatically with the track for use in the analysis screen.

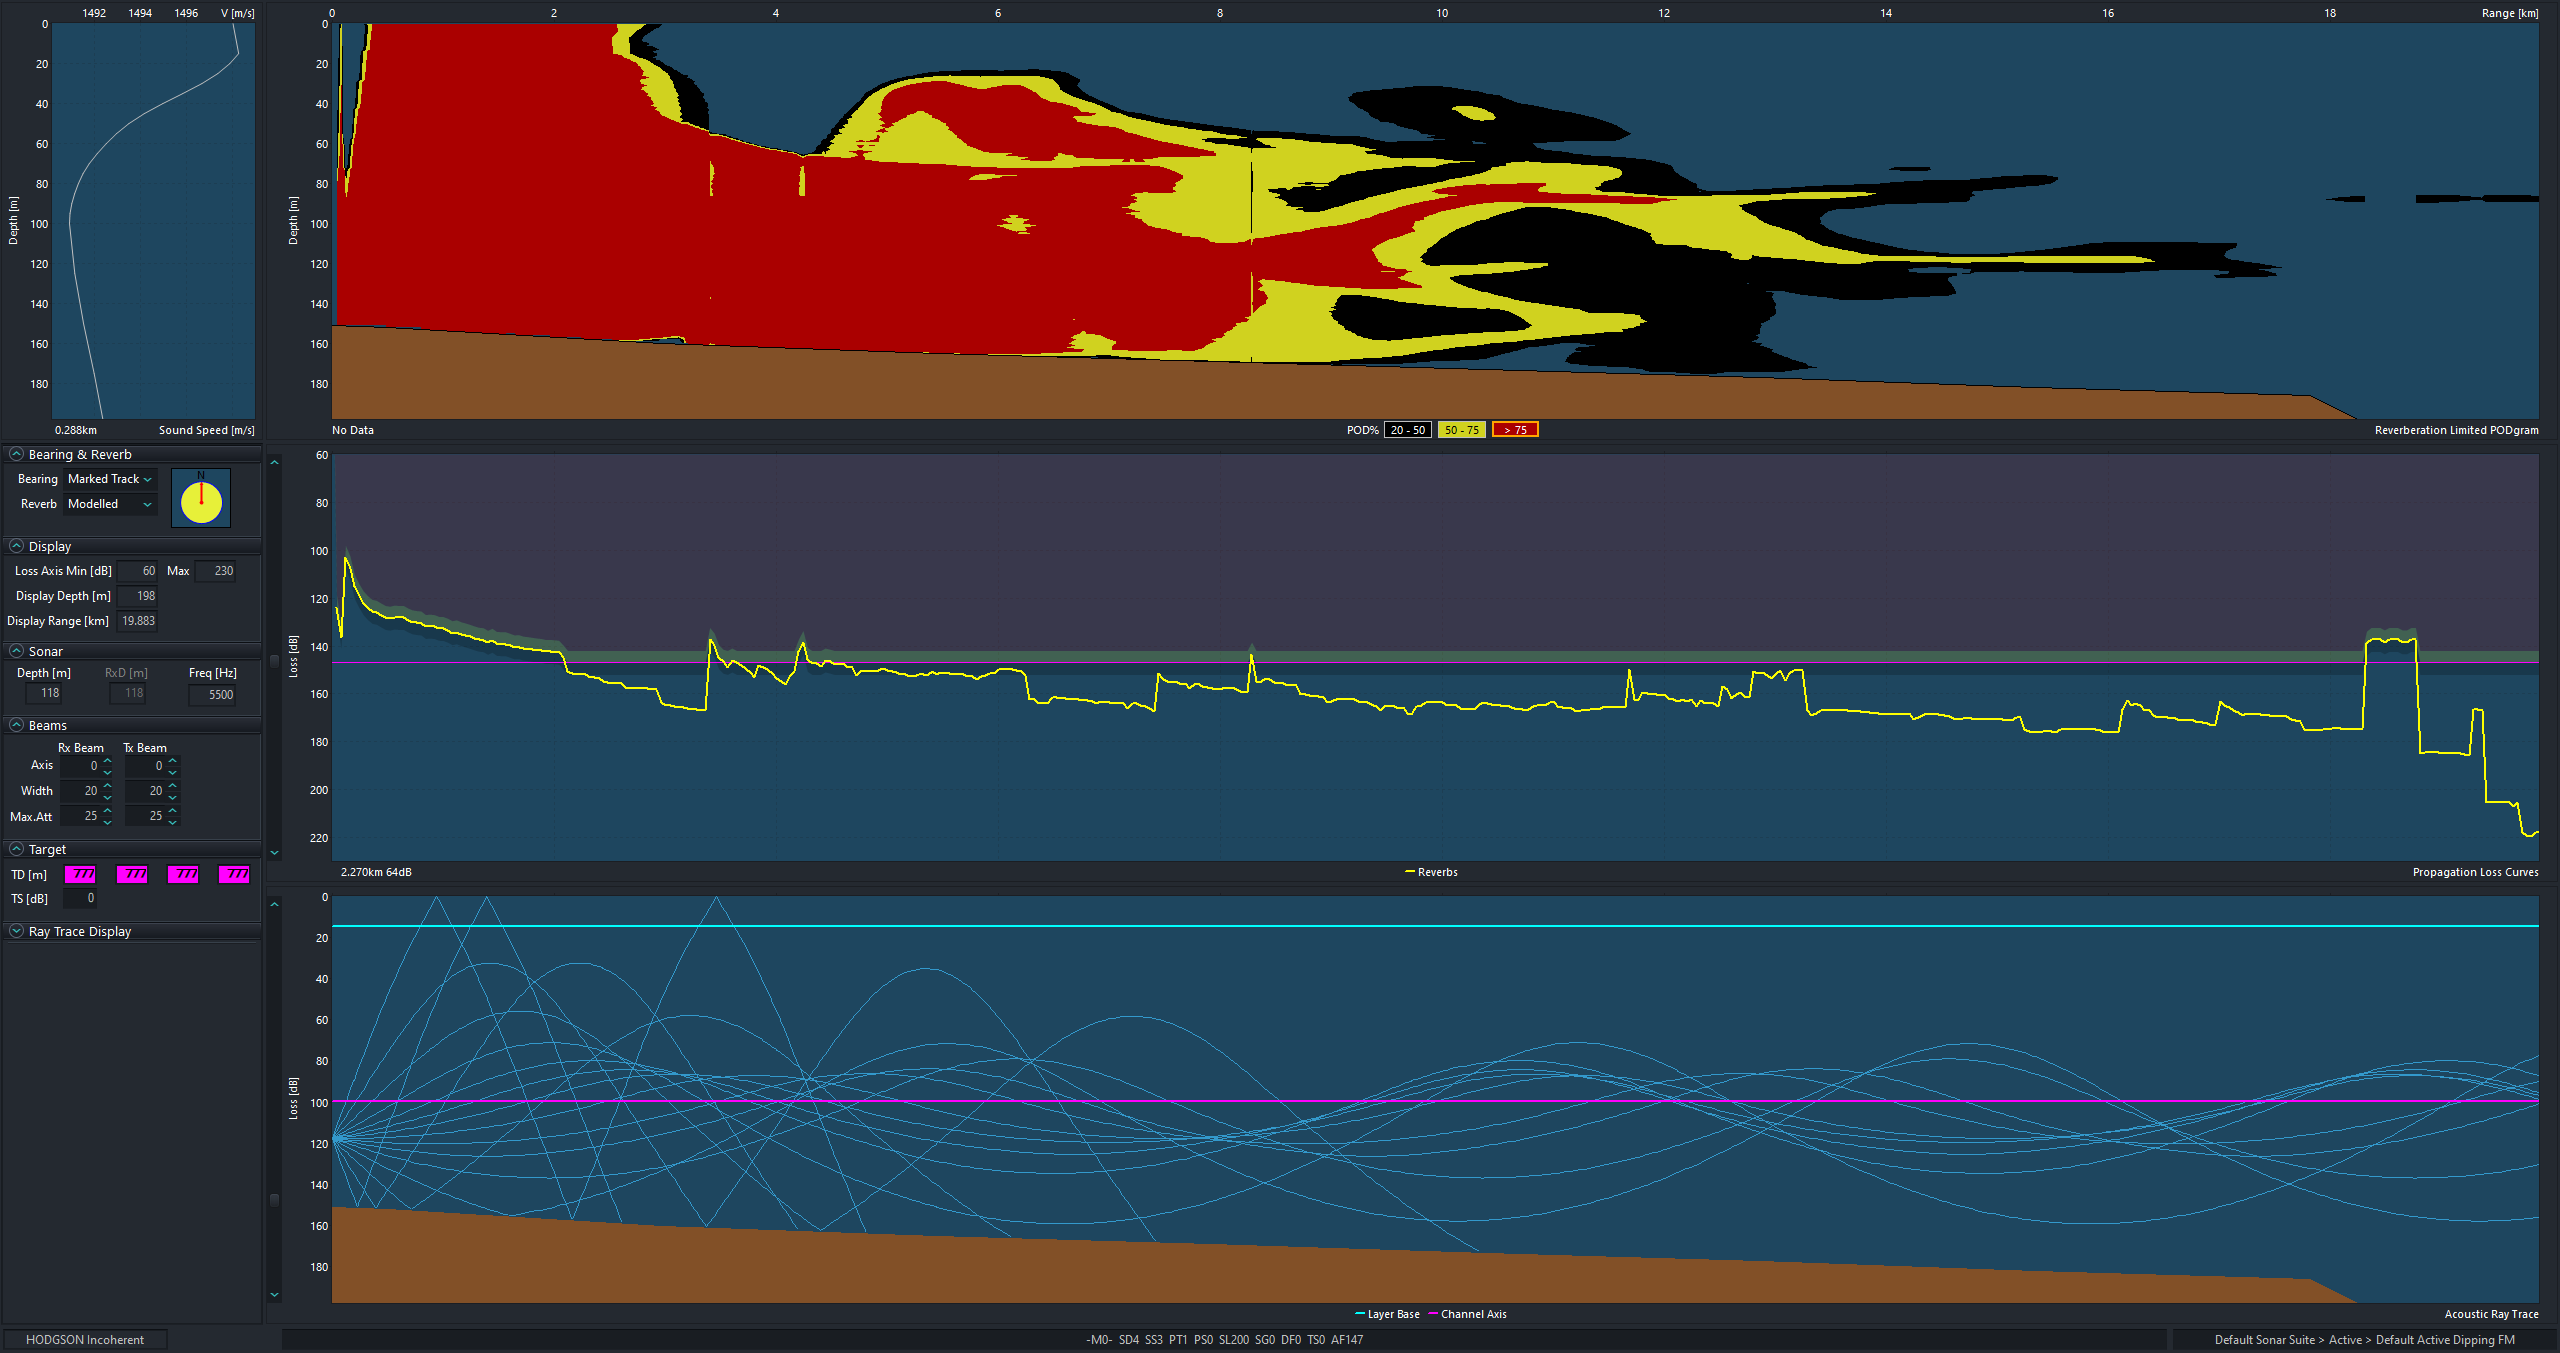
ANALYSIS SCREEN
The Analysis Screen is where the user conducts detailed Propagation Loss Analysis (Proploss). The screen has a Probability of Detection (PoD) diagram (PODgram), Propagation Loss graphic, Ray Trace diagram and Profile display. Users can also display an Environmental Impact Assessment (EIA chart), best source depth and intensity distribution chart. In-situ adjustments can be made for ,amongst others, reverberation losses, target/source depths & sonar beam angle. Parameters for shipping, sea state and ambient noise are accounted for in the embedded Figure of Merit (FOM) calculators.
Contact Us Today!!
Our Offices
Address:
41 Starview Avenue Vaughan B0N 2T0 Nova Scotia Canada
Phone:
+1-902-306-7191